Simple performance monitoring a Laravel Forge deployed application
Maintaining a performant web application is an on-going task. On launch you might have requests flying out the door at maximum speed. But as your application grows, either in concurrent users / requests, or database size, no doubt you will start to find bottlenecks in your application that you did not (need to) account for at launch.
When first launching an application, getting something out the door is more important than making sure you have indexed every suitable column in your database. Why? Well, without users there is no need for indexing...as the speed of performing zero database queries in production is already pretty dang fast! I'm not saying performance shouldn't be a concern at launch - but you don't want to fall into the trap of wasting time on premature optimisation.
But of course there comes a time when your application has grown and performance comes into your focus. Do you spend time scouring your codebase and database logs for places to optimise? This is an option, sure, but what is the most important factor? What am I really trying to achieve by doing this?
Outside in monitoring
I believe the best way to tackle performance is to focus on what matters most. This is not the slowest database query, or the slowest filesystem read / write, it is the slowest request. Take an outside-in approach to performance.
Your slowest request might contain your fastest database query but is then followed by a filesystem read that is slowing the entire request to a halt - in this instance, looking only at database queries is the wrong place to start. Spend your time making optimisations that have a measurable, real-world impact on your web application's end users.
Server
I use Laravel Forge to deploy my application servers. I know I am not a server expert and I want to use a tool that takes care of the majority of my needs with the click of a few buttons. At some point I'm hoping to put aside some time and go through the Servers for Hackers courses. If you are very comfortable with configuring Nginx this article is probably a waste of time for you, if not, hopefully you will find it useful (and you might also wanna checkout the Servers for Hackers stuff as well).
Right tool for the job
There are several places that I could do the request monitoring. Being comfortable with Laravel / PHP, my first thought was...maybe I just do it in a terminable middleware, or I could throw Telescope at the problem. And these might work fine, however as nice as Telescope is, I don't really want it storing every single request that comes through the production system.
I might reach for Telescope to help debug a specific issue. Perhaps if I find out there is a slow request for the api/users route, I might turn it on temporarily to monitor requests to that specific endpoint.
After discussing this with others, I quickly came to the conclusion that these options were not the best tool for the job. The webserver is the best place to do this.
Nginx perfomance logging
So I set out reading up on Nginx logging and found I could setup a log that will monitor the time each request takes to process on the server. I also wanted my performance logs to be in CSV format, so I could easily parse, view, and sort them.
The first thing I did was create the logging format using the variables outlined in the docs...
"$request","$status","$bytes_sent","$request_time"
This will allow me to see the request that was made (although not the entire request content, which is where I might reach for Telescope), and the duration of time the request took to process on the server. Next thing is to add it to the Nginx config. I can do all of this within the Forge UI.
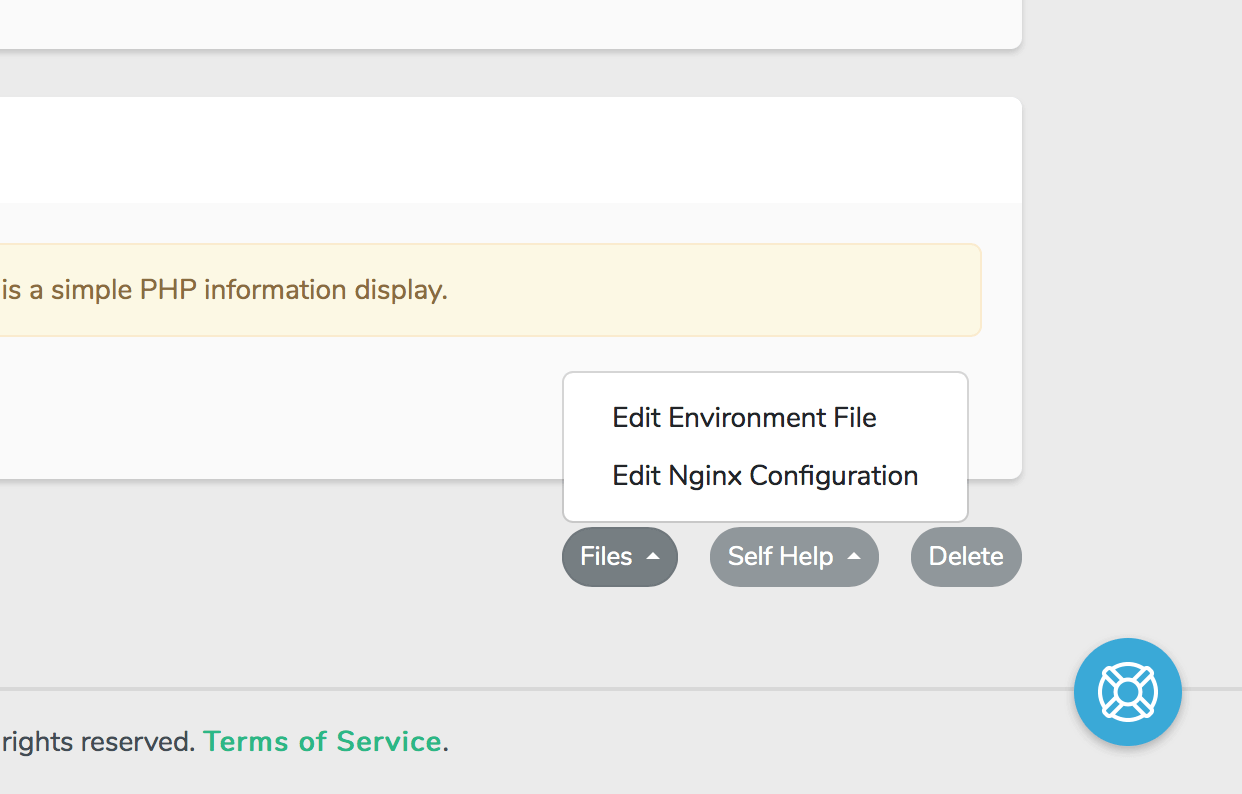
Open up the site and scroll down to the files button and edit the Nginx Configuration.
At the top of the config, after the include forge-conf/... statement and before the server { block, add the logging format as shown below.
# FORGE CONFIG (DOT NOT REMOVE!)
include forge-conf/my-site.com/before/*;

# 👇

##
# Log formats
##
log_format performance '"$request","$status","$bytes_sent","$request_time"';

# 👆

server {
    ...
I have just configured Nginx to provide a log format called "performance" that will contain a CSV separated list formatted like this...
| Request | Status code | Bytes | Duration (in seconds) |
|---|---|---|---|
| GET /api/users?page=1 HTTP/1.1 | 200 | 7427 | 0.020 |
| GET /api/users/32974/events?page=1 HTTP/1.1 | 200 | 3520 | 0.037 |
But there is one last step. I need to tell Nginx to use this log format and to also make sure that the access logs are turned on.
In the server block scroll down until you find the access_log entry. Turn the access log on, and then add the following...
server {
    ...

    access_log on;

    # 👇
    access_log /var/log/nginx/my-site.com-performance.log performance;
    # 👆

    ...
Important: You should change my-site.com to your actual sites domain.
Now the webserver is logging all incoming requests and how long they are taking to process. At any stage you can tail or download and review these requests to ensure you application is running as smoothly as you think it is.
No doubt, this solution will only work up until a point, at which time you will need to look into something more robust.
Active vs passive monitoring
Remembering to log in and review the log files is fine - until it isn't. For my applications, this solution is working fine for now, but no doubt at some point this will become to much manual work and I will look to automate the process.
My first step might be to create a script that parses the log file to notify me of requests over a certain threshold, but there are plenty of existing solutions to log monitoring I could also look into.
Laravel Forge gives easy integration with Papertrail via the UI and I've also seen DataDog recommended. Although I have not personally used these services yet, no doubt they would have a simple solution for all of this baked right in.
Keeping it simple
I always try to keep things as simple as possible, for as long as possible. Once my current setup becomes annoying or a time sink, I'll be moving on to outsource and automate it. If you have any tips or tricks that could improve my current setup, I would love to know. If you know of a great service to handle the next phase of my performance monitoring, would love if you could reach out and tell me about it.
More to consider
The time a request takes to process on the server is a great metric for a backend developer to pay attention to, but there are so many other things you need to also take into account.
- How big is the response?
- How long is it taking for request / response to get from the user and back?
- Are caching headers setup correctly?
...and the list goes on. Monitoring the performance of your application from a backend perspective is only just the beginning, but it is also a good place to start.